Section1 About the Report
This is a summary of our fifth industry benchmark report, which is our most comprehensive study of drone market trends and usage to date. This year’s research uncovers fresh insights on which industry players are thriving (and which aren’t) and how businesses are using drone-acquired data in their day-to-day operations. We believe this report fills a gap in knowledge and understanding of the commercial drone industry concerning:
Who’s buying what types of drones from which makers at what prices and for what uses.
How large the drone-based service providers are, and how they position themselves to their target industries.
Who the business users of drone-based projects are, which industries have traction and how much is being spent on drone services.
How much service providers, business users, and public agencies are using operations management and insights/analytics software for drone-based projects.
How the various market players have been impacted by rising US-China trade tensions,speculation around the security of drone products and the COVID-19 pandemic.
Data collected for this study comes from a survey we conducted over the web in June and July 2021, as well as interviews with companies and agencies throughout 2021. The study evaluates four distinct segments of the market:
Drone Aircraft and Payload Purchases
Business and Public Agency Users
Service Providers
Software Apps and Services
Our online survey garnered over 1,800 responses representing 39 industries across 110 countries.
Our analysis yielded 8 key insights that summarize the current state of the four segments, as well as overall market growth and drone use by industry.
This year we have added additional figures and data points to better communicate how survey responses varied across different sectors and regions.
The report includes 92 figures, 7 tables, and an appendix listing our survey questions. This is a significant expansion from our 67 figures in 2020, and fewer in the years before.
Outline of the Full Report
As our analysis has gotten deeper, we have also made some slight adjustments to the structure of the report to make it easier to consume and navigate. Additionally, you will likely note that this report is now also available in a secured online format. This opens up additional linking, searching and navigation possibilities that weren’t possible before. This is particularly critical as the expanded scope of the report has added complications to interlinking and references which are solved with this online format.
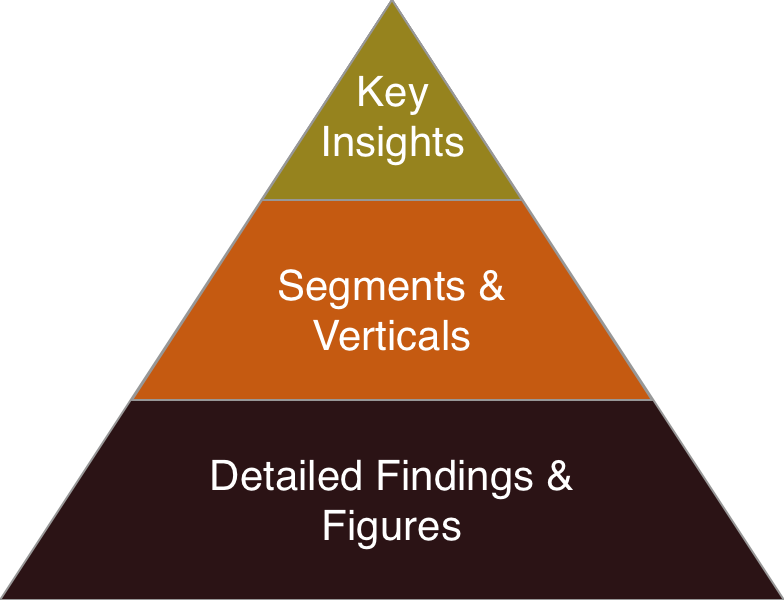
The report is divided into three core sections - 3 Key Insights, Understanding Segments and Verticals and Detailed Findings and Figures (dispersed across four chapters). These three core components fit together like a pyramid, with the most detail at the bottom and the most relevant conclusions at the top (see figure below for reference).
The Detailed Findings section presents the results and analyses from each survey question. It contains all the figures and tables. It is organized to match our survey, with four sections that correspond to the four major segments of the drone industry. They are listed below and can also be found through the table of contents/navigation tab to the left:
Drone Aircraft and Payload Purchases
Business and Agency Users
Service Providers
Software Services
This Detailed Findings section makes up the majority of the analysis (>90%) and is only available through a purchase of an Enterprise License of the report. These findings are critical for industry stakeholders or potential investors to better understand the market and can be purchased here.
As a new addition this year, we have cut a variety of our data points by sector, which offers unparalleled insights in narrow sectors that businesses operate. This concept is easier explained visually than read, so we have included sanitized examples of what this looks like in the figures below.
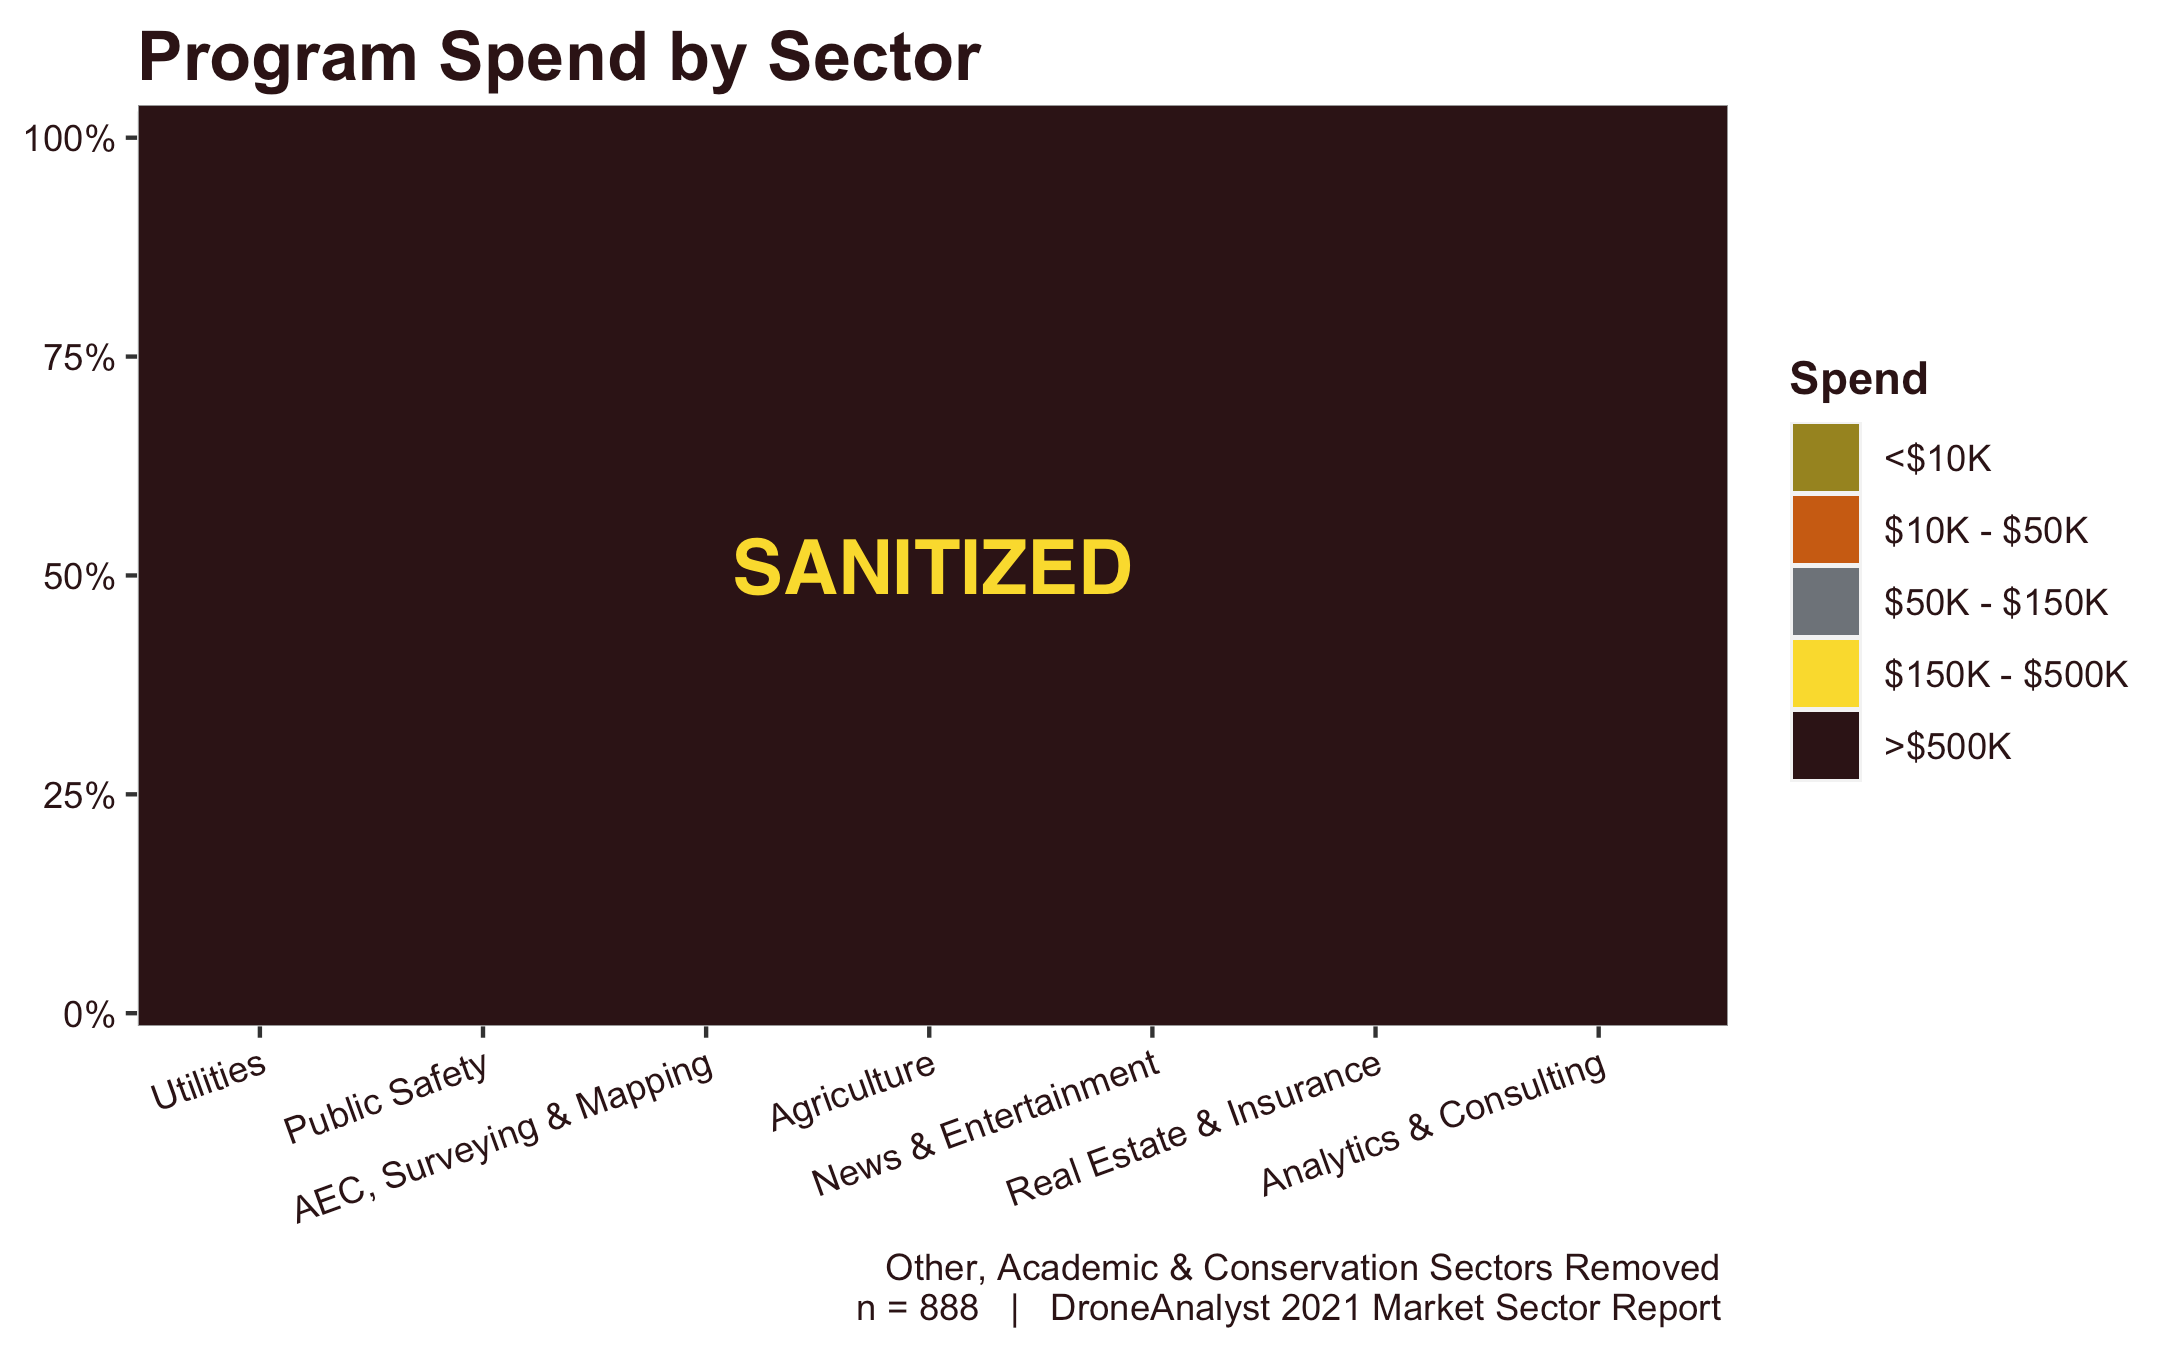
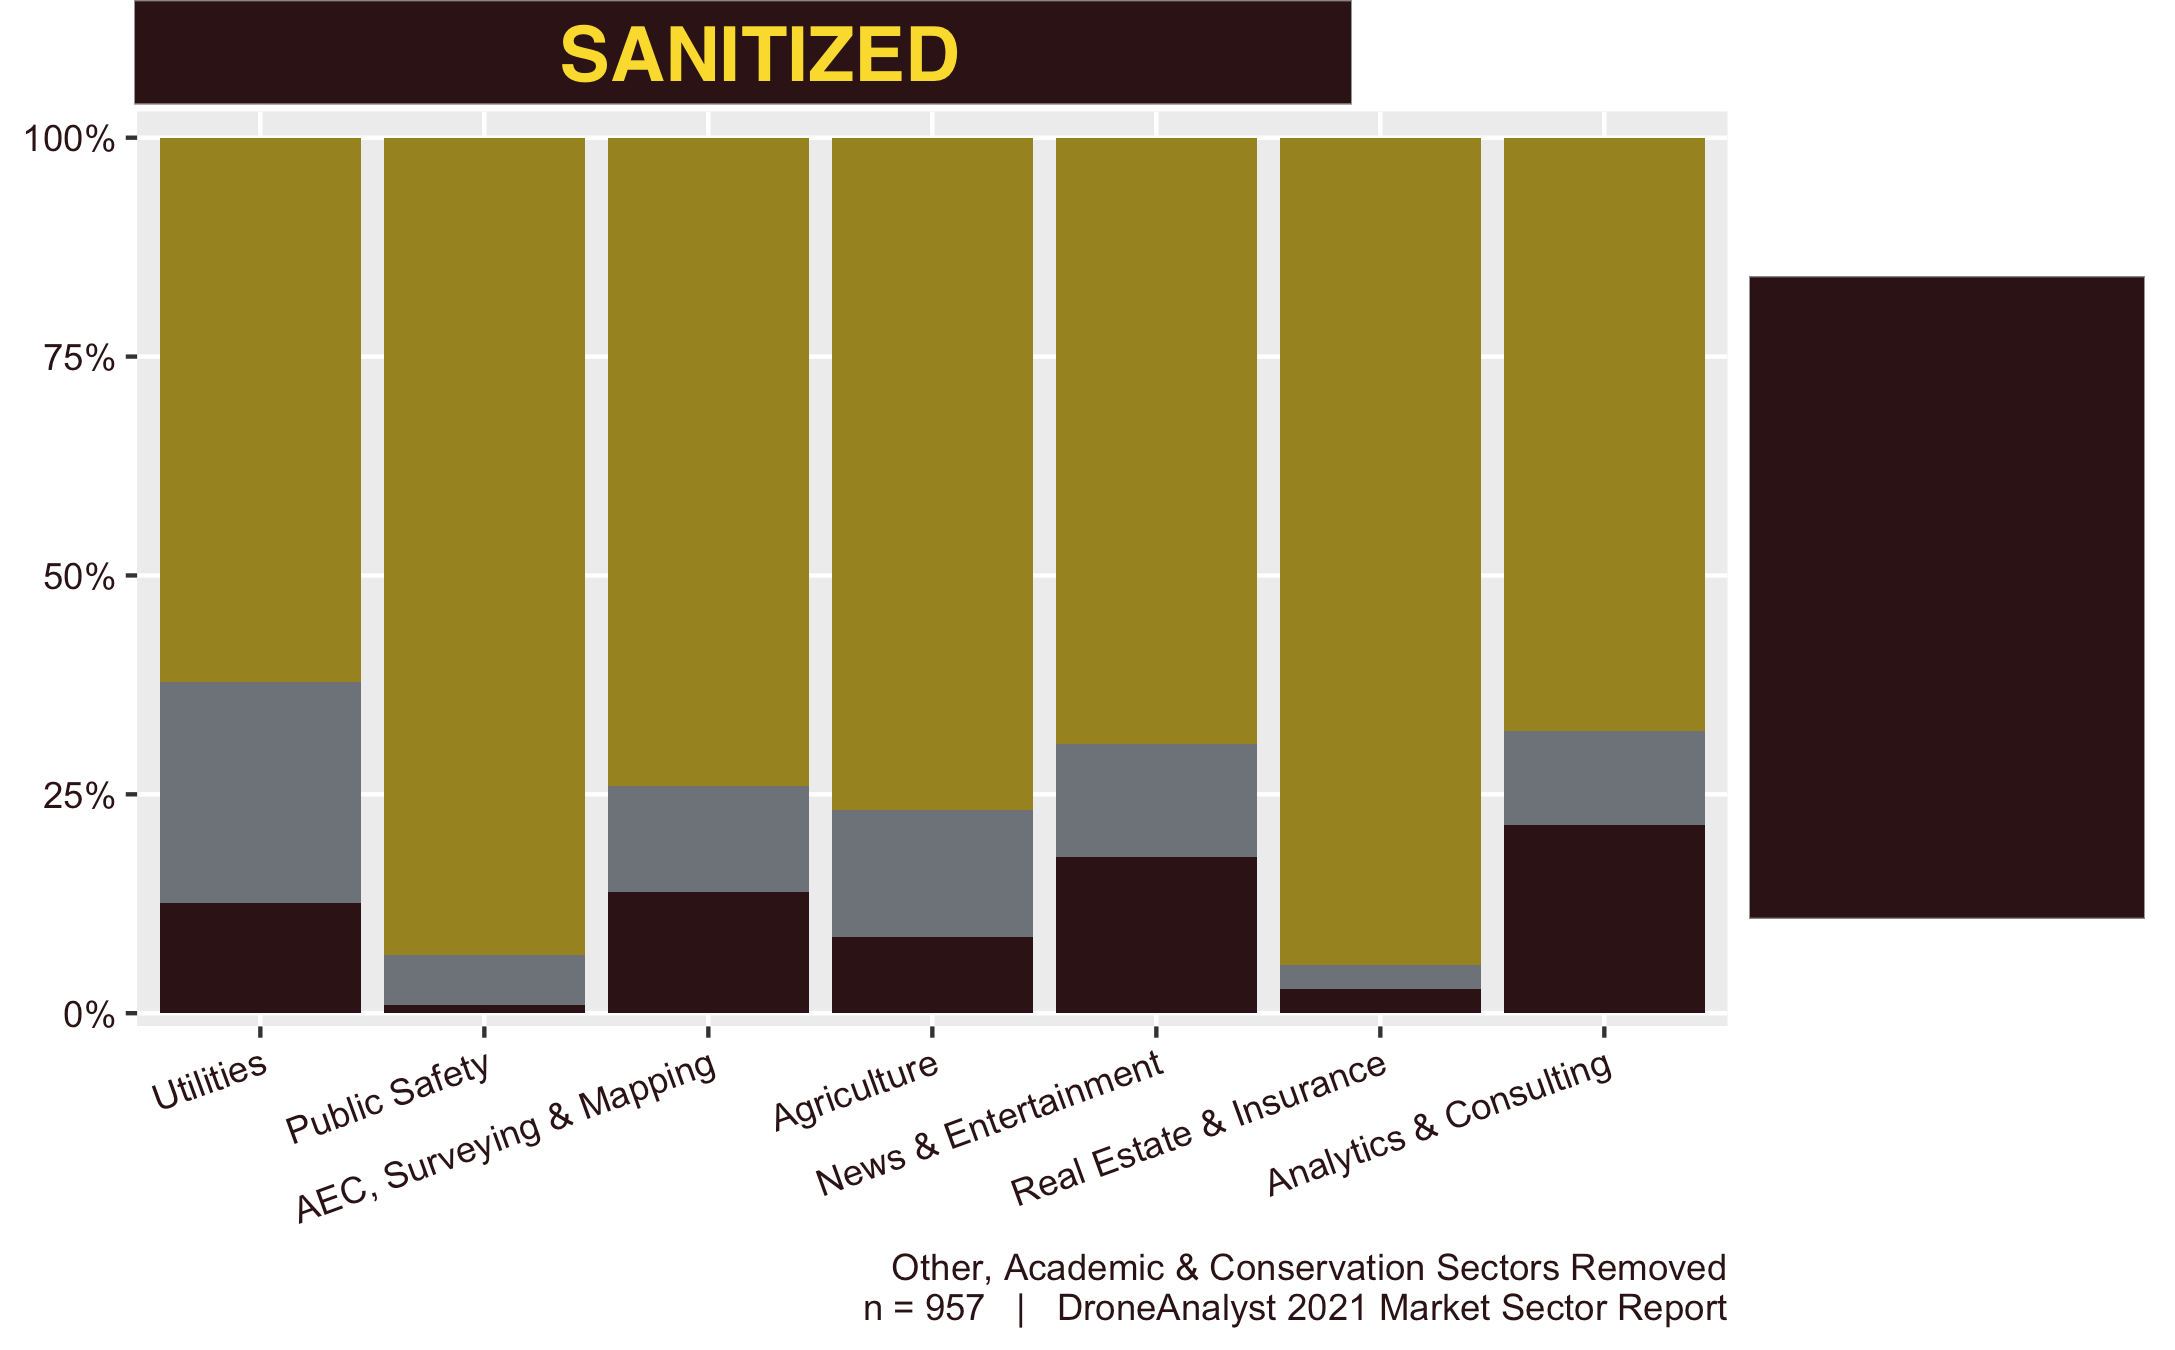
Example of Figures Split by Sector, Available in the Full Report
The Understanding Segments and Verticals section summarizes and analyzes the detailed findings for each of the four industry segments. It also includes the results from our industry interviews.
The Key Insights (3) section provides the 8 most significant industry insights we gleaned from our detailed analysis and interviews.
Each section of the report is accessible through the tab on the left, and sections with figures and tables will include a linked list of figures/tables. You will also be able to directly navigate to sub-components of each section through this navigation pane.
Lastly, it is important for you to read and understand the demographics behind our survey in our first numbered section (and the next major section of the report), Demographics (2) . This section runs through the demographics and demographic changes behind our survey data. You can access the next section through the left navigation pane or click the arrows on the sides of this page itself.
Reading our Figures
Each of our figures includes a few key textual elements in the bottom-right footer which are important to pay attention to, these include:
Sample size (n): this is included dynamically for each figure in our report and refers to the amount of unique respondents who contributed to the data of a specific figure. This helps provide more context to the reliability of each figure and the trade-off between more nuanced/segmented datapoints and accuracy of findings. Sample size is included on all figures except figures that compare trends across multiple years.
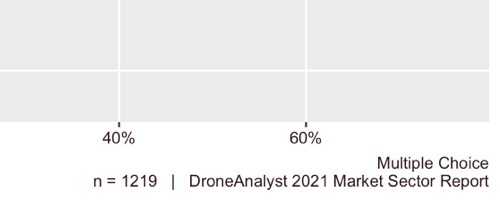
Multiple Choice: some of our survey questions are multiple choice questions where users can select one or several different options. At times, respondents can even write in multiple Other selections (we instruct them how to do this so it is readable, then automatically parse out these and combine various spellings). As we calculate percentages on graphs based on individual responses, instead of relative responses per graph, the total sum of each option on a figure will add up to above 100%. For clarity, we mark all such figures where the question is multiple choice as such.
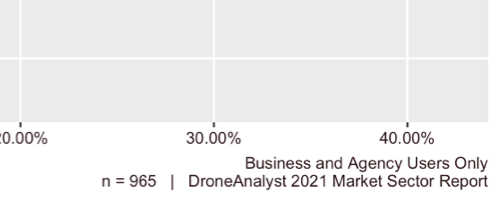
Sub-groups/filtered data: each section of our report relies on specific, qualified responses for that section, with notices about the breakdown by industry/sector at the beginning of the section. For some figures or data points, we further segment the respondents to unveil interesting insights. In such situations, we will mention the limitations or exclusions at the bottom right of the figure, and the sample size market will dynamically change to reflect this as well.
An example of what this looks like is provided below.
List of Figures in the Full Report
For those interesting in learning more about what is included in the full report, we have included a complete list of figures below. We have included a few of the most relevant figures in this summary throughout the demographics and key insights section.
Figure 1: Respondents by Region
Figure 2: Respondents by Section(s) Answered
Figure 3: Respondents by Age
Figure 4: Respondents by Role(s)
Figure 5: Respondents by Seniority
Figure 6: Respondents by Decision Making Authority
Figure 7: Primary Sector of Purchase
Figure 8: Primary Use of Purchase
Figure 9: Changes in Professional Purchase Objective
Figure 10: Drone Aircraft Type Purchased
Figure 11: Drone Types by Sector
Figure 12: Drone Brand Market Share
Figure 13: Drone Brand Market Share by COO
Figure 14: Historical Country Market Share
Figure 15: Drone Brand Market Share by Sector
Figure 16: Drone Brand Market Share by Region
Figure 17: Most Expensive Drone Purchase
Figure 18: Most Expensive Drone Purchase by Sector
Figure 19: Use by Price
Figure 20: Where Drones Are Purchased
Figure 21: Changes in Place of Purchase
Figure 22: Purchase Channel by Sector
Figure 23: Camera and Sensor Integration Method
Figure 24: Sensor Type(s)
Figure 25: Sensor Type(s) by Sector
Figure 26: Sensor Brand Market Share
Figure 27: Add-on Payload Market Makeup
Figure 28: Other Mounted Accessories
Figure 29: Other Mounted Accessories by Sector
Figure 30: Primary Purchasing Factors
Figure 31: Primary Purchasing Factors by Sector
Figure 32: Necessary Security Features
Figure 33: Necessary Security Features by Sector
Figure 34: China Security Concerns
Figure 35: Chinese Product Concerns by Sector
Figure 36: Chinese Product Concerns by Region
Figure 37: Primary Sector of Business/Agency Users
Figure 38: Primary Mission of Drone Program
Figure 39: Business and Agency Organization Revenue
Figure 40: Seniority by Sector
Figure 41: Number of Years Using Drones
Figure 42: Number of Years Using Drones by Region
Figure 43: Phase of Drone Program Development
Figure 44: Drone Program Structure
Figure 45: Drone Program Structure by Sector
Figure 46: Business and Agency Historical Services Model
Figure 47: Services Model by Sector
Figure 48: Methods for Sourcing Pilots
Figure 49: Training Method(s) Used
Figure 50: Number of Staff Involved in the Program
Figure 51: Staff Involved by Sector
Figure 52: Quantity of Drones Owned or Leased
Figure 53: Fleet Size by Sector
Figure 54: Business and Agency Program Spend
Figure 55: Program Spend by Sector
Figure 56: Expected Spending Changes
Figure 57: Expected Spending Changes by Sector
Figure 58: Drone Program Challenges
Figure 59: Changes in Drone Program Challenges
Figure 60: Program Challenges by Sector
Figure 61: Business / Agency Adoption of Automation
Figure 62: Expected Impact of Autonomous Drones
Figure 63: Expected Impact of Autonomous Drones by Sector
Figure 64: Adoption of Other Robotics / Unmanned Products
Figure 65: Other Robotics / Unmanned Products by Sector
Figure 66: Sector of Services Offered
Figure 67: Primary Services Offered
Figure 68: Number of Years Providing Drone Services
Figure 69: Years Offering Services by Region
Figure 70: Revenues from Drone Services
Figure 71: Revenues from Drone Services by Years in Business
Figure 72: Number of Full and Part Time Employees
Figure 73: Participation in Drone Pilot Networks
Figure 74: Pilot Network Share by Sector
Figure 75: Pilot Network Share of Service Providers
Figure 76: Future Hiring Intentions
Figure 77: Issues Inhibiting Service Providers
Figure 78: Changes in Issues Inhibiting Service Providers
Figure 79: Software Type(s) Used
Figure 80: Most Critical Software Category
Figure 81: Overall Software Market Share
Figure 82: Software Consumption Preferences
Figure 83: Software Consumption Preferences by Sector
Figure 84: Stakeholders with Access to Drone Data
Figure 85: Insights / Analytics Software Market Share
Figure 86: Insights / Analytics Software Market Share by Sector
Figure 87: Insights / Analytics Software Category Maturity
Figure 88: Insights / Analytics Primary Purchasing Factors
Figure 89: Drone Operations Management Software Market Share
Figure 90: Drone Operations Management Software Market Share by Sector
Figure 91: Drone Operations Management Software Category Maturity
Figure 92: Drone Operations Management Software Primary Purchasing Factors
List of Tables in the Full Report
For those interesting in learning more about what is included in the full report, we have included a complete list of tables below.
Table 1: Changes in Section(s) Answered Over Time
Table 2: Average and Median Drone Prices Over Time
Table 3: Top 5 Drone Services Outsourced by Business and Agency Users
Table 4: Changes in Reported Revenues Over Time
Table 5: Fleet Size and Revenues of Service Providers
Table 6: Software Attachment Rate by Respondent Type
Table 7: Software Attachment Rate for Different Business and Agency Users