Section2 Demographics
List of Figures
List of Tables
- 2.1: Changes in Section(s) Answered Over Time
Details
The following charts depicts demographic and qualifying data for respondents who took our survey. This data is useful for understanding the target market for drone use. Our 2021 survey received a total of 1866 qualified responses, with a completion rate of 63.3%. The completion rate is on-par with estimates for similarly sized surveys and our survey last year (61.3%). We also found an overall increase in the number of respondents, up over 500 respondents from 1,345 last year. This makes sense as we better distributed the report along channels that worked well last year, and 2020 was a reintroduction of DroneAnalyst and this survey, so our reach was relatively limited. Additionally, this figure does not count over 300 spam responses that were filtered by duplicate identifying information (IP, email, name) and illogical or lowest effort responses on key test questions we implemented. As we moved to a cash award instead of a product award, this was to be expected.
The sample size is sufficient to provide a confidence level of 99% and margin of error of ± 2.99 in the worst case scenario where a question is neck-in-neck responses of a binary question and across a population of 15 million – which we estimate the drone industry is well below.
The data shows the majority of respondents were from North America (60% from US and 5% from Canada), 17% from European & Central Asian countries with the other regions making up 18% of responses. A detailed breakdown is displayed below in Figure 2.1.

Figure 2.1: Respondents by Region
This is a fairly similar breakdown to last year’s demographics, where we saw a strong concentration in North America (at 56%). Notably, this year we saw a large uptick in North American respondents, and a deeper concentration on European & Central Asian respondents outside of NA. While the ratio of European & Central Asian respondents is similar to that of last year (16.4%), the absolute number of these respondents is higher as we had more respondents overall. Other regions had similar amounts of responses as last year.
Of course, the key limit for most regions is that this survey was administered solely in English, so responses are biased towards regions and countries that primarily speak English. For our analysis, this means that data and figures specific to North America, and to a lesser extent Europe & Central Asia, are more accurate than those in other regions. Data on other regions has issues concerning sample size and selection bias, so interpret data points specific to these other regions as loose indicators.
To better understand our respondents, we have broken down the proportion of respondents who completed each section of our survey. This is the best indicator for general representation of respondent’s broad role(s) in the industry, as it is based on specific actions taken and includes several tests in the survey that ensure they fit in this category.
This is visualized in the figure below, with further information on each section in the following text. It’s important to note that respondents could participate in multiple sections of the survey, such as being a service provider that is both a buyer of drones and software services. Therefore, the percentage represents the portion of all respondents that participated in a specific section, adding up to above 100%.
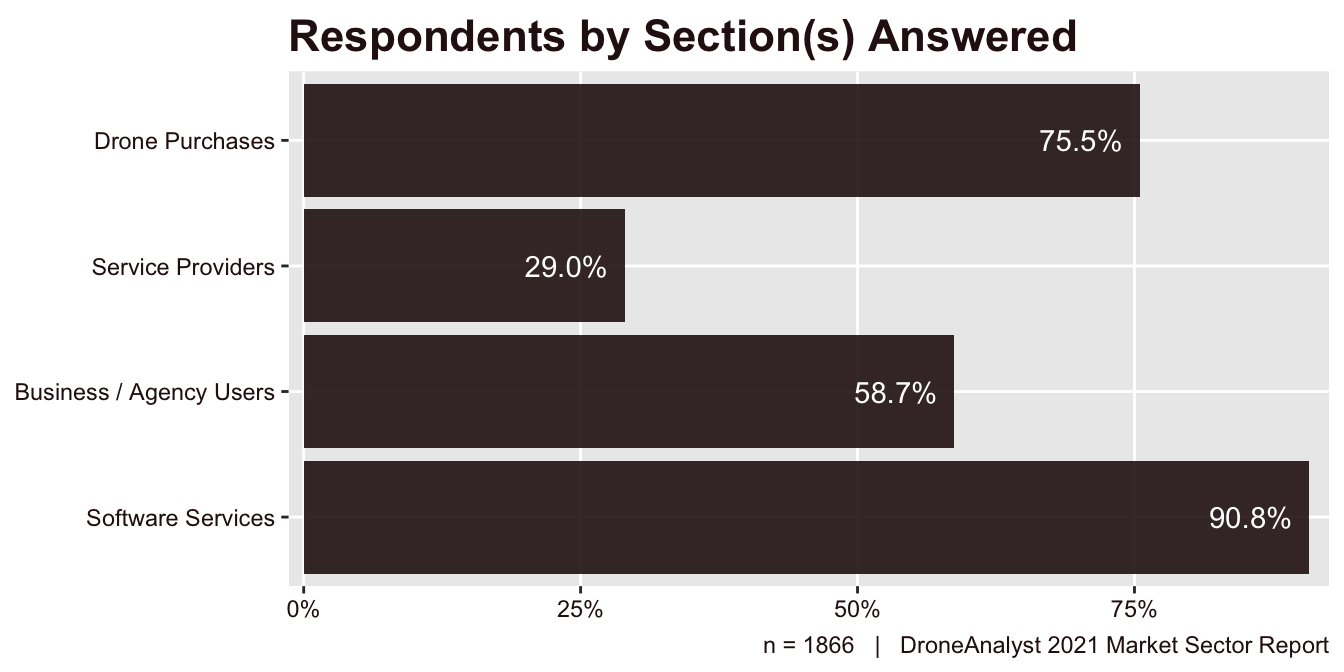
Figure 2.2: Respondent(s) by Section(s) Answered
To paint a better picture on what each respondent must have answered to enter a particular section of our survey, we have broken that down below:
Drone Purchases: Purchased one or several drones over the past 12 months
Services Providers: Respondent or their organization offers drone-based services for outside hire/sale
Business / Agency Users: Respondent or their organization performs drone operations and/or contracts for drone-bases services as part of their internal work/projects
Software Services: Respondents or their organization regularly use software to support their drone operations
These results show a dramatic continuation of a trend seen in our 2020 report. That trend is the rise of Business / Agency User respondents and a drop-off in service provider respondents. While these two categories were nearly equal last year (at roughly 35% each), Business / Agency Users has shot up to over 60% while Service Providers has continued to level off.
We have compared the historical portion of sections answered in the table below. Note that this does not include all 5 years of the report, as we made structural changes in 2018 which mean that 2016 and 2017 did not have the same sections as our recent years.
| Section | 2018 | 2020 | 2021 |
|---|---|---|---|
| Drone Purchases | 78.0% | 68.0% | 75.5% |
| Service Providers | 39.0% | 35.0% | 29.0% |
| Business / Agency Users | 24.0% | 36.0% | 58.7% |
| Software Services | 57.0% | 75.0% | 90.8% |
| DroneAnalyst 2021 Market Sector Report |
Last year we speculated that the drop in Drone Purchases (which stipulates a purchase was made in the past 12 months) dropped due to COVID-19. A return to 2018 levels of responses to this section suggests that most buyers have recovered from any COVID-19 budget freezes.
Additionally, we speculated that our 2020 drop in Service Provider responses was a sign that many US-based service providers have exited the market entirely. This was additionally supported by our 2018 data that 50% of service providers had operated for less than 12 months, and 16% of these businesses made no revenue and a larger 62% made under $50,000. In 2020, we saw only minor improvements to these financial figures. We hold onto this theory, but are also seeing it come full circle, with less service providers in the market we are finally seeing the financial outcomes of the few providers left improving. We dive into this deeper in our section on Service Providers.
We also asked about respondents’ ages, limiting choices to correspond with generational groups, and can be viewed in Figure 2.3 below.
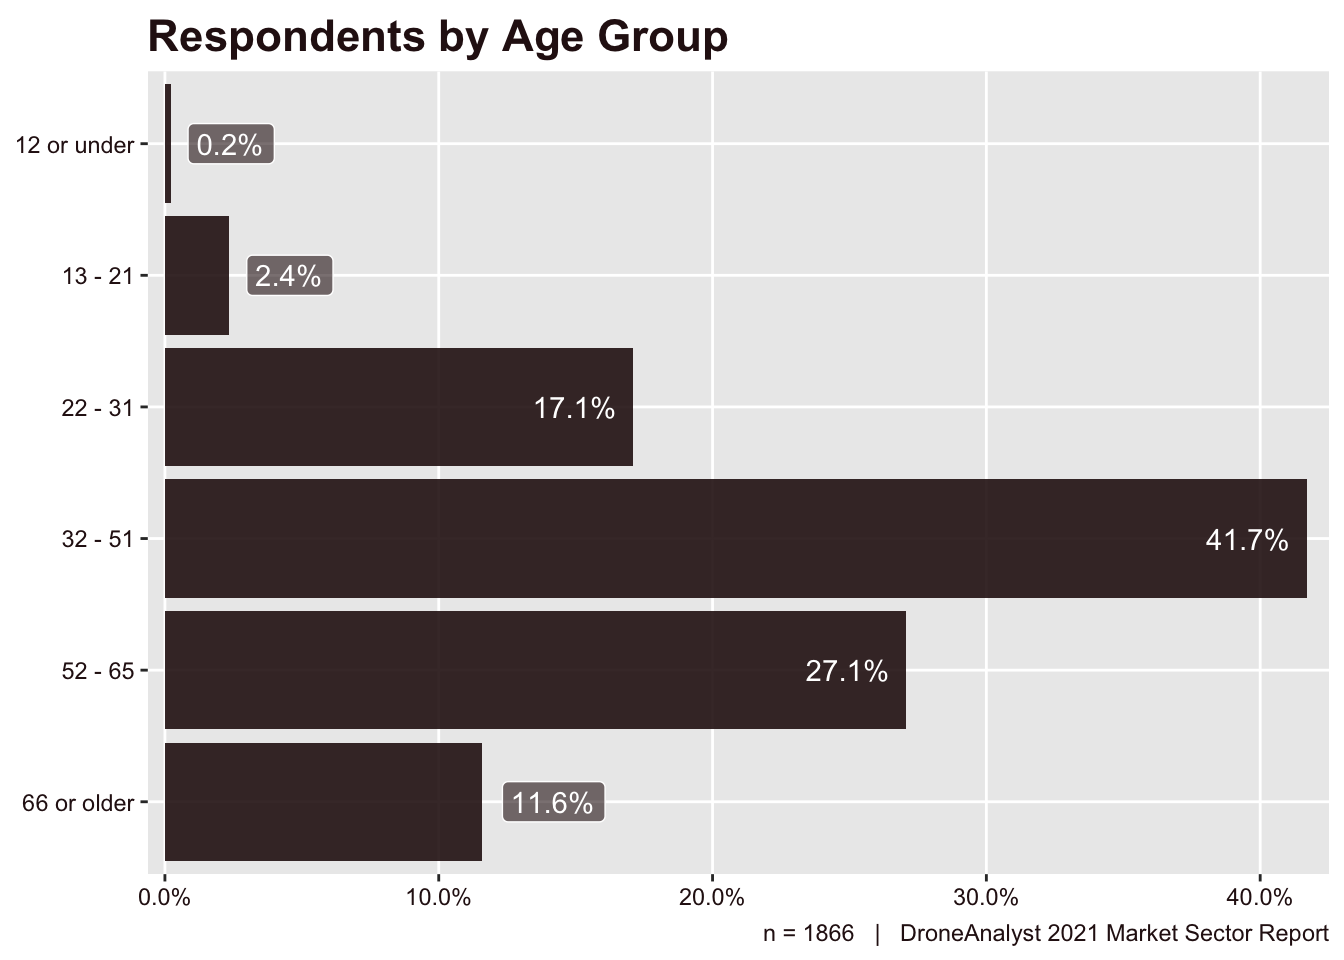
Figure 2.3: Respondents by Age Group
Respondents are not dominated by one generational demographic, although it is important to note that the majority of our respondents are older than 32. We continue to see increases among those aged 22 - 31, which increased from just 12% in 2018.
In general, this trend holds for all regions, with two notable exceptions. North America has a relatively larger proportion of Boomer respondents, with a slightly larger amount of Boomers than Gen Xers. South Asia is the other exception, with its most populated generation being Millennials. All other regions are mostly concentrated in the Gen X category.
Additionally, we identified participants’ functional roles in the industry. Respondents could select as many as applied (see Figure 2.4), resulting in the totals adding up to above 100%. These responses do not tell us too much about our respondents, but does help to understand how service providers and business/agency users self-identify into non-concrete categories such as drone hobbyist.
Readers should note that we did not use the answers to this question for any tabulations. Instead, we used this data occasionally to validate answers to questions later in the survey for major respondent types: pure hobbyist, professional users (who may also be hobbyists), drone service providers, and business/agency users.
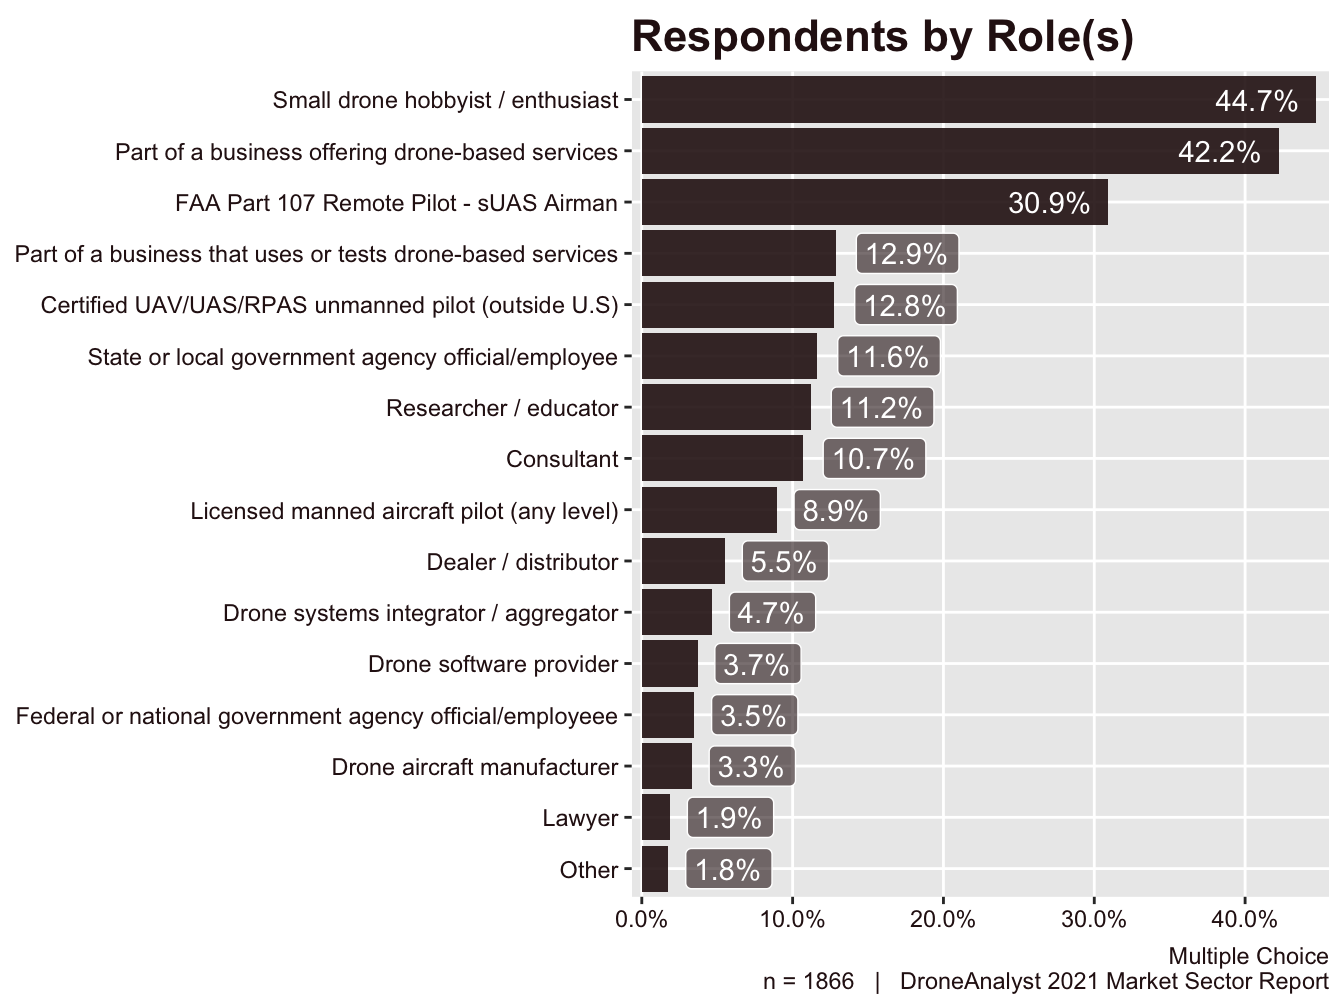
Figure 2.4: Respondent(s) by Role
Despite our comments above about not overemphasizing these data points, there are some interesting trends here. While we continue to see a large group of respondents identifying themselves as a small drone hobbyist / enthusiast, this is the first year that less than 50% of our respondents identified as such. This likely reflects the growing maturity of the commercial drone industry and the rise of business / agency users bringing in other working professionals with no drone interest into the drone industry.
We have long seen the trend of hobbyist interest driving activities elsewhere across the industry (and have written about the impacts here). This trend is neither positive nor negative, but it is an important cultural shift to note.
To better understand the seniority and quality of respondents that we received, we added a question in the “About You” section of our survey about the respondent’s seniority level. This will better help readers understand the nature of our respondents. It is important to note that not all things are equal. The leader of a drone program at a large utility with a sizable budget may be deemed a manager while a leader at a service provider with a comparably low budget could be a C-suite executive, Owner or CEO.
We later explore the relationship between the industry business and agency users are operating in and seniority among the respondents within our section on Business and Agency Users, This helps us better understand the internal structure of these drone programs, with large differences among key industries.
We show the results from this question in Figure 2.5 below.
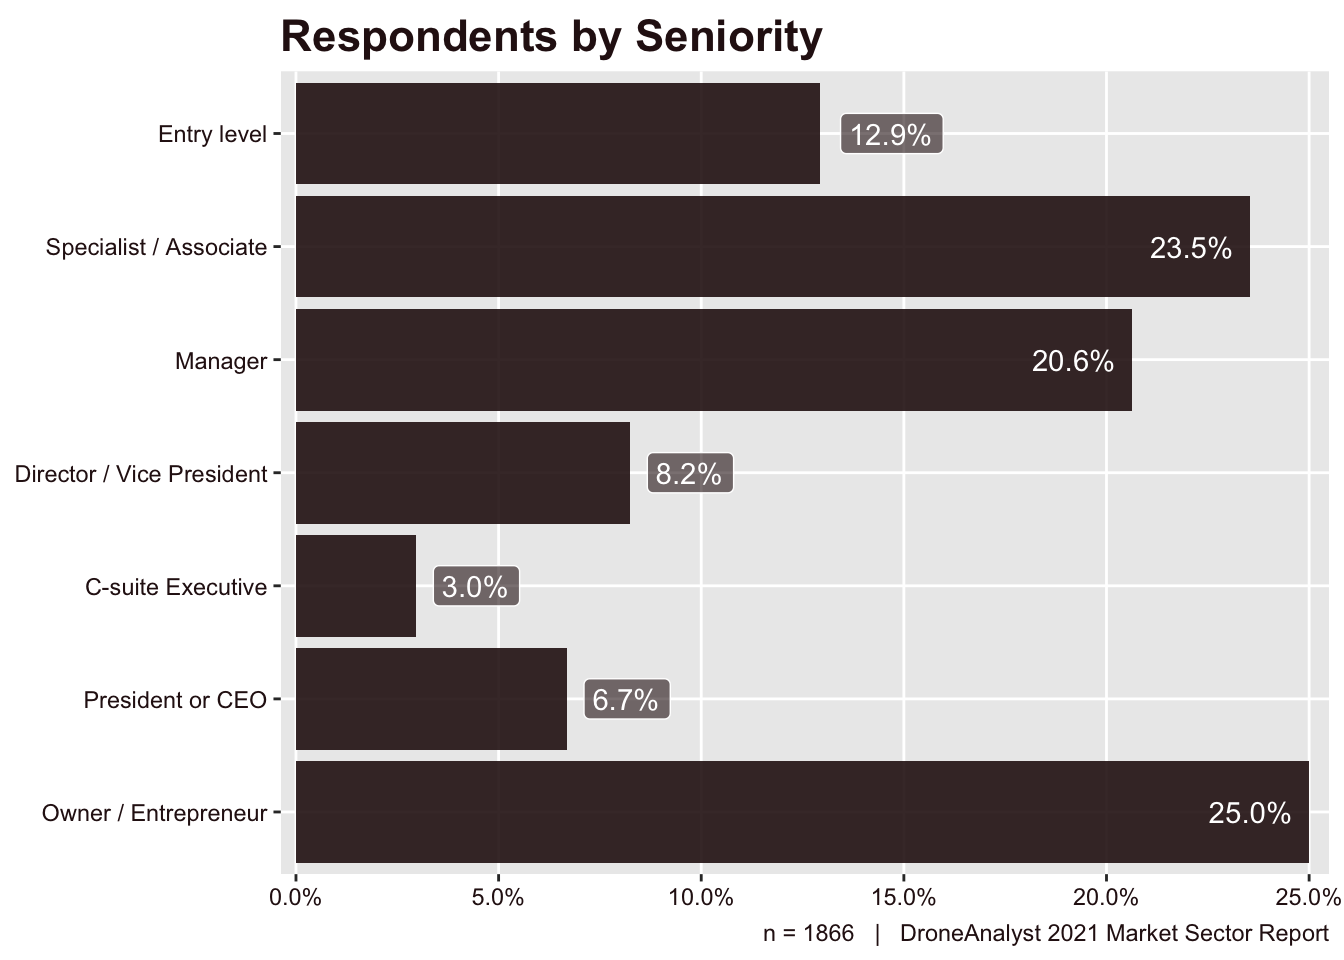
Figure 2.5: Respondents by Seniority
Overall, nearly two-thirds of our respondents are a manager or higher, suggesting we have received responses from an influential swath of the industry. Similarly, nearly 20% of respondents were Director / VP level or above (not including Owner / Entrepreneur).
The large amount Owners / Entrepreneurs came disproportionately from service providers, where they made up 31% of that segment. This makes sense considering that many service providers are sole proprietorships.
Lastly, we asked only Business and Agency respondents about their purchasing authority, to better understand decision making within a drone program, and also to understand the quality of our respondents.
We asked respondents specifically about their purchasing authority for drone-related hardware, software and services, and mentioned this would also include individual authority or as part of a group/committee within their organization. Users could choose that they had final-decision making authority, significant decision making or influence, minimal decision-making or influence or had no input. It is important to note that the Final option is more specific around buying authority while the others included influence.
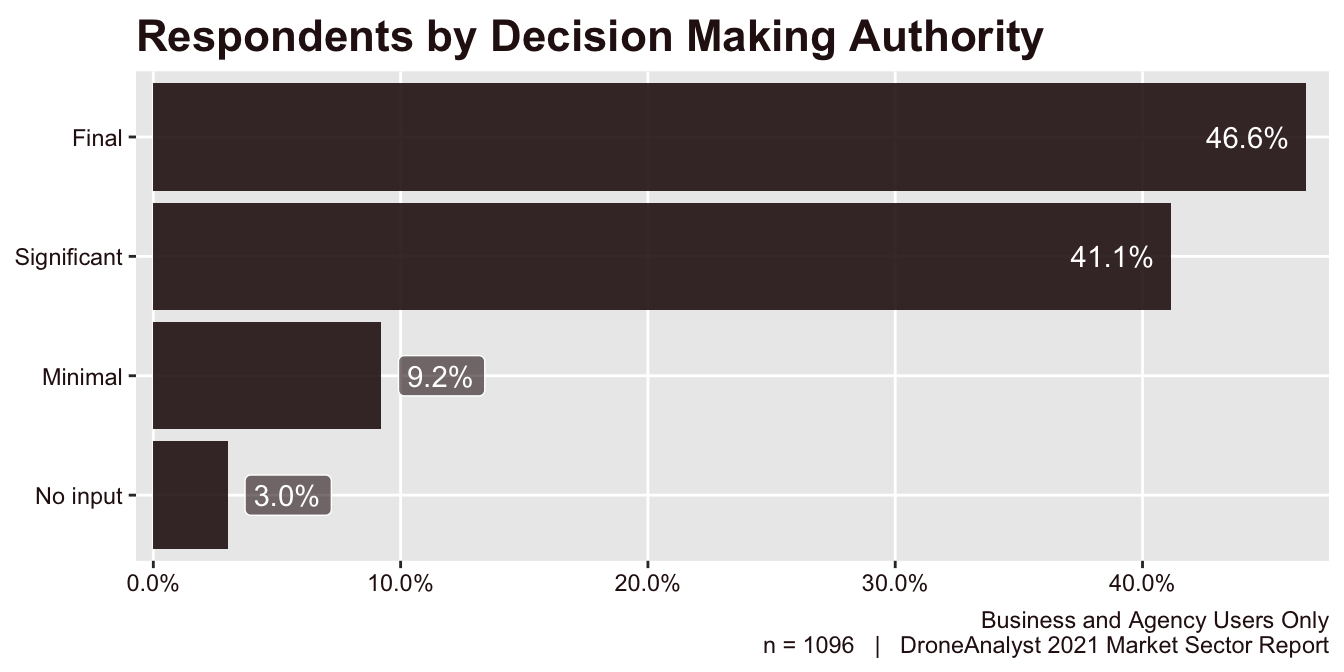
Figure 2.6: Respondents by Decision Making Authority
Over 80% of our respondents said they had final or significant purchasing authority, with over 40% having final decision making authority. This reflects our previous findings in Figure 2.5 on Seniority, where our audience tends to be high up in their organization.